
by Tom French, user researcher for the Data Collective and facilitator of Sheffield Data For Good
Since November, the Data Collective pilot has been conducting user research. There were a whole host of questions we were trying to answer, including (but certainly not limited to):
- Who’s the Data Collective for and what does this mean for others who aren’t part of it?
- What happens in the Data Collective and what does it do?
- What is the Data Collective trying to achieve and what outcomes is it aiming to bring about?
- How can the Data Collective structure its activities to promote participation?
- How can the Data Collective organise and share content or outputs?
As we near the end of that user research, analyse what people have said, and reflect on the things we have tried out so far, things are becoming clearer. We’re still sifting through the data from 20 interviews, two user research workshops, and 54 survey responses, but some recurring themes became clear early on…
Interestingly, one of the headlines from the user research was a lack of clarity about what the Data Collective is and does. In turn, this led some people to feel hesitant about joining or committing their time to it, particularly given the strain on resources in the sector at the moment. Furthermore, people asked explicitly what success looked like for the Data Collective and how that could be measured in the medium- to longer-term, beyond the pilot phase that ends in April.
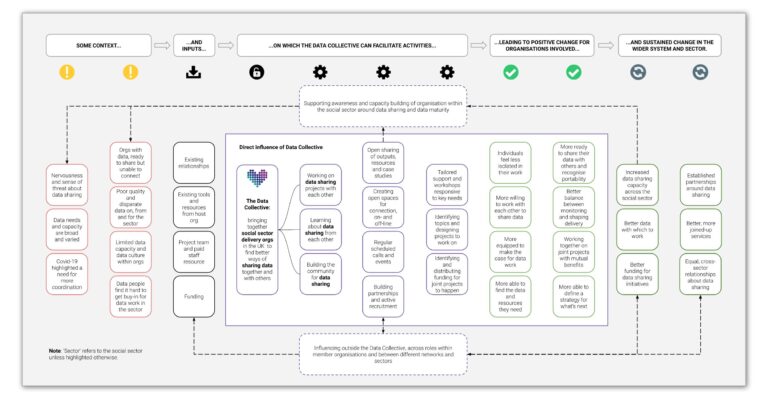
With all of this in mind, we have developed a visual logic model (or theory of change, if you prefer; or a diagram, to give it a more accessible label) to map out the context for the Data Collective, what has been put in place, what will happen through it, and the change we expect to see as a consequence. Here it is…

The user research also highlighted that some people weren’t sure of how the Data Collective would be of benefit to people outside its membership i.e. the social sector at large. The logic model attempts to address that by showing not only what happens within the Data Collective itself, but also how its influence permeates beyond that through shared resources and new partnerships.
This is only the starting point for this model. We expect it to change over time as we learn more. It’s also not going to be the only output from the user research. A summary of all findings is underway as we speak and will feed into the recommendations made at the end of the pilot for the future of the Data Collective.
Community round up
- Share your story! Does your organisation have a data success story to tell? You’ve told us that many organisations feel held back by cultural barriers to taking up data-informed practices – like senior management not being ‘bought in’ to data, or ‘non-data’ colleagues struggling to engage. And you’ve also told us that you’re hungry for stories of success from other organisations who have overcome these barriers. If your organisation has overcome barriers to data use, we would love to hear from you! It might be better use of data day-to-day, better data collection, or perhaps you’ve managed to transform senior decision making approaches. Please get in touch with Giselle.
- Data roles in the charity sector: Our listing of data vacancies within the charity sector now has roles with Citizens Advice, Sense, and the National Lottery. If you have a job role you’d like added or see something missing here, please send us an email!
- More data news: If you don’t have enough newsletters in your life, Gavin Freeguard asked what data newsletters, podcasts, and event series we should all be checking out and made an open list here!
- Charity classification: Howard Lake asked on Twitter about charity taxonomies. This coincides with Chris Damm’s blog about his charity classification project with David Kane and NCVO. It links to the draft list of UK charity classifications that they’re trying to develop automated keyword search rules for. There’s also a link to a feedback form in the blog if you’d like to tell them your thoughts. Finally, John Fitzgerald’s team are behind the SCVO Digital taxonomy.
- And Glossaries: Collective Community organiser Mor Rubinstein is also looking for examples of charity data glossaries, like this example from Humdata – please email us with any good examples you have!
- Geospatial data: We enjoyed James Bowles’ blog on ‘How charities use geospatial data’. Key ways the data were used include asset maps, informing service delivery, using data towards policy and advocacy efforts, and to engage stakeholders.
- Thank you: Thank you to everyone who gave us their time to complete the survey. We’re currently working on analysing the results to help us work out where the Data Collective goes next.