


Help us build a more inclusive Data Collective
Over the next few weeks, we’re asking people who’ve worked with data in the social sector to participate in some user research with the Data Collective, a peer learning community for people who work with data in the social sector.
Our user research isn’t just about designing a community that works for most people, but one which adapts and moves to work for everyone. The research is being conducted by an intersectional feminist group called the collective.
We’re undertaking user research to:
- Understand who makes up our community
- What our community needs
- Build an truly inclusive community
- Decide how to develop and grow the Data Collective in the future
You can participate in this user research in these 3 ways:
- A short-ish survey
- 2 focus groups (see below)
- Some open questions (on our LinkedIn and Slack)

Why does this research matter?
Data is increasingly important to everyone, but working in data in the social sector isn’t always easy.
While our community is not exclusively made up of people who work in charities, we can gather from from the 2023 Charity Digital Skills report that:
- Data is a key priority, with 59% wanting to use data and insights to improve their services or operations.
- There has been little movement in the number of charities lacking skills to collect, manage and analyse data. 59% rate themselves as fair at this and 28% poor. These data points have barely changed since 2020, showing how charities need support in this area.
- The biggest challenge, faced by 48% of charities, is to use data to inform strategy and decision making.
- 4 out of 10 charities also lack the time to focus on data.
- Charities also face a range of operational challenges with data, including collecting the right data and analysing it (both 39%). 26% find making the most of their CRM (including reporting) an issue.
It is also observable that these needs increased for organisations run by and/for people from structurally disadvantaged backgrounds.
We would like to understand how the Data Collective can support in tackling those challenges by building a community where people are able to feel safe and confident enough to ask for support and share their learnings. We would love to create a community where we can support each other to improve our data maturity.

Traditional Diversity, Equity and Inclusion methods don’t always engage with justice – and we believe that in order to build a community that actually embraces everyone in the sector, we need to understand who makes up our community, who is missing, why people struggle to join the Data Collective and struggle to work with data in the social sector.
We want to use this research to:
- Design our community to actually meet the needs of the people involved
- Ensure that we support people where they actually are, and actively move to not leave people behind
- Understand what and how barriers prevent people from participating in the Data Collective, and in data in the social sector.
We hope this user research will help us learn how to design a community that results in:
- A space where people feel comfortable and confident enough to share and learn about data from each other.
- A community where even those with limited resources can understand and use data better to improve their organisation’s impact.
- Events and resources being used to meet the needs of diverse groups, and resulting in no-one and no organisation left behind.
We believe all of this is fundamental to our larger mission, which is to ensure that everyone who works for social change is able to use data wisely and effectively to improve their impact.
Who should participate?
If you’ve ever worked with data for social change, then we would love to hear from you. We know this can be many roles in the sector, but could include – for example:
- Working with or developing your charity’s CRM
- Measuring and developing Impact and Evaluation
- Data analysis
- Research
- Data for fundraising
- Senior leader who makes decisions on data collection, use and analysis
- Senior leader who uses data to make decisions
- Build digital products using data (eg maps)
You can:
- Work directly for a charity, non-profit, social enterprise, CIC or B-Corp
- Work for an agency which supports other social sector organisations with data
- Work as a consultant who supports other social sector organisations with data
We welcome participation from people who’ve never attended or participated in a Data Collective event or on our Slack before.

How can you participate?
- Fill out this survey
- Attend one of our Focus Group sessions
- 7 December, 2 – 3:30pm For everyone
- 14 December, 2 – 3:30pm For those who are structurally disadvantaged (inclusive of, but not limited to: ethnic minorities, gender minorities, LGBTQIA folks, working class folks, D/deaf and Disabled folks)
- Answer some of our social media questions (keep an eye out on on LinkedIn and Slack)
Understanding data about the social sector: What have we been up to?
When we launched the Data Collective, we learned that there is huge interest in improving the use of data by charities, social enterprises, voluntary organisations, and the umbrella bodies supporting their work. But also, there is a clear need to improve what is known about infrastructure and data for the sector as a whole, from charity registers to service locations.
Thankfully, there is a keen group of people who are taking collective action to work on these challenges – the Data About the Sector Initiative. This is what we’ve done so far, and how you can get involved.
Coming together to learn and collaborate
At the end of 2021 we kicked off the Data About The Sector initiative – a collaborative programme of work to improve data about the social sector.
After meeting with interested parties and holding an open meeting for anyone who wanted to be involved, we established two groups for organisations and people who were working on existing projects on data about the sector. Participants include representatives of national and regional membership bodies and infrastructure organisations, and universities working in this field.
One group was focused on Place Based Infrastructure organisations moving towards a shared approach to data collection, the other on Data Publishing Standards, working to improve interoperability to allow more effective analysis of data from across the sector.
Throughout the first 6 months of 2022 these two groups met monthly sharing updates about what they were working on and any related news they’d heard, getting input from their group on ideas they were working on, and finding opportunities for collaboration where there was overlap in projects or shared areas of interest.
Some examples of things the groups covered included:
- Better location data: Establishing opportunities for collaboration on how to improve collection of location data about where charities deliver their services versus where funding is received.
- Sharing knowledge: Pooling knowledge about different sources of UK data about the sector. This is a work in progress – please let us know if you have anything you think should be added to it!
- Charity Commission: Inputting into a Charity Commission review looking at what data they collect from charities.
Plans for the future
When asked for reflections on the work, participants said that hearing about each other’s work (data about the sector and data infrastructure projects) has great value in itself.
Participants also saw a lot of overlap in the two groups, so we have merged them.
We are now running quarterly sessions focused on hearing updates from each other’s projects, any other ‘data about the sector’ news people have come across, and identifying any topics for collaboration or further discussion e.g. where a smaller subset of people might want to get together separately to discuss an area of focus or joint working
The first meeting after merging the groups was in November 2022, and we would love to welcome new members. You can learn more about what we’re covering and who is involved by reading the meeting notes from the full group sessions which will be updated each time we meet
Get Involved
- The sessions are open to anyone who is working on this topic in the sector. If you’d like more information, please get in touch with Roz Sutton.
- The project is part of the Data Collective, a community of people using data in the social sector. Find out more and join up here.
Help us build collaborative leadership on social sector data
By Tom Watson and Roz Sutton
In July we wrote about all of the reasons why we need leadership on data in the voluntary sector, and how you could get involved. It was based on research carried out over April and May 2021 that looked at challenges and opportunities around sector data. The research showed there are major challenges to understanding the sector, many of which stem from poor data. There are a number of reasons for this: limited investment in data infrastructure, limited data sharing, and unstandardised data to name a few. Our research also showed several ways forward, including a clear need for coordination and leadership.
We know the problems, and collectively we may have the solutions, so we created an open invitation to act together. The blog served as a call to action, and happily there was a lot of interest….honestly more than we had anticipated! We‘ve spent a fair amount of time in the last six weeks talking to people individually to understand how to bring all this interest and expertise together in a meaningful way. We tried to speak to as many people as possible, but if we weren’t able to talk to you, know that we do want you involved! Our approach is to be open, and for this work to evolve with your input and ideas.
These conversations allowed us to outline some overarching goals and an initial plan based around a ‘hub and spoke’ model, which allows for expertise and engagement with different areas and data topics.
What are we trying to achieve?
We have set some overarching goals for this work, including:
- More timely, standardised, granular data in order to support the sector’s decision making about where the sector should focus effort.
- A coordinated approach for engagement with Government on sector data.
- To be a focal point for learning, expertise and collaboration on sector data.
Other goals will emerge as this work develops.
An outline for collaborating

We propose a hub and spoke model (pictured). Spoke working groups will focus on specific challenges, in partnership with a central Hub, which will consist of data and non-data specialists. The Hub will:
- Provide leadership, challenge, and insight.
- Act as a conduit for information from the Spoke working groups to facilitate alignment and collaboration.
- Provide a bird’s eye view of activity.
- Assess where to focus collective effort and energy.
- Shape future ambitions for development in sector data.
- Support institutional knowledge beyond the life of any one Spoke.
The Hub will have representatives from Spoke working groups. Spoke working groups will address specific needs, and their make up will be self-determined. Some may be time limited.
There are some groups beginning to form but this is a developing process that will invariably change as we go.
How we’ll work together
Below we set out some of the key elements of how we intend to work together.
Collaborative leadership
One of the key principles we have followed is that we want to build collaborative leadership which isn’t beholden to the priorities of individual organisations. The challenge, and in our view, the solution to improving data about the sector is bigger than any one organisation, so we have spent the last six weeks attempting to lay the foundations for collaborative leadership that grows beyond us. We hope to provide the momentum and some of the drive to make this happen, but we cannot be the gatekeepers.
Principles
Our starting principles for how we work are:
- Focus on user needs, identifying the opportunities and issues to be addressed.
- Focus on agreeing practical actions that we can collectively take forward.
- Engage all stakeholders as equal contributors by respecting the autonomy of different organisations and working groups and the need for collaborative rather than centralised leadership.
- Work openly and share progress regularly.
- Recognise that decision making involving multiple, independent organisations and individuals is difficult and needs everyone involved to support the process.
- Aim to surface where there are people with shared aims and the energy to take collaborative action on items, rather than looking for complete consensus within all groups.
- Design governance collectively, ensuring all participants from all groups are involved in decisions regarding governance of relationship between groups and changes to these overarching principles.
What next
We are holding an open meeting from 9.30-11am on Thursday 21 October to present and discuss these plans to those interested in helping us take it forward. From there, we hope to form the Hub and initial spoke groups and begin working on the challenge including how to fund this work.
Please register here to join the meeting.
If you’d like more information, please get in touch with Roz Sutton.
By Tom Watson and Roz Sutton who have been undertaking this work on behalf of the Data Collective
If you are interested in hearing more from the Data Collective, sign up to our email newsletter and Slack channel here, or follow us on Twitter and LinkedIn
Why we need leadership on data in the voluntary sector, and how you can get involved
By David Ainsworth, freelance journalist.
Over April and May, Tom Watson of The Good Ship and David Ainsworth carried out research into what data exists on the social sector itself. The research, carried out at the request of the Data Collective and Catalyst, concluded that there are big gaps in existing data on the sector, and that collective action and collaborative leadership is needed to move us forward. We’re forming a steering group to drive this work. If you are interested in hearing more about this work, please get in touch with Roz Sutton.
Where are we right now?
This picture won’t surprise anyone who’s done a lot of work with sector-level data.
There is a lot we do know, but plenty that we don’t. We don’t really know where charities operate, we can’t get an accurate picture of the workforce, and we have almost no useful information about trends in volunteering. This has three major implications.
First, the low quality of data on the sector is hampering leaders when they ask for policy changes that will benefit social sector organisations. It’s hard to demonstrate the value we deliver to the Government and to society, even though we’re sure it’s considerable. Good data is one of the many things we need in order to tell the story of the sector better.
Second, as we know a limited amount about who’s delivering what services, where they’re doing it, and what results they are getting, it is hard for operational or infrastructure organisations to benchmark their effectiveness or identify where there are gaps they should address. Similarly, it’s hard for funders to get a picture of the whole sector, and to draw clear conclusions about where funding resources should be applied.
And third, it’s very hard to draw useful conclusions about whether charities are doing what they should. This creates the feeling of an accountability gap, particularly around big public institutions. One of the results of this is a growing culture of distrust in the public eye, press, and Parliament.
Why isn’t the quality of data good enough?
There are a number of reasons – too many to list.
One problem is that the best source of data on charities is annual accounts filed with the Charity Commission, but that information is not as easy to use as it could be. It’s often provided in the form of hard-to-read PDFs, there’s a lot of variation in how charities report their spending, and it’s not timely – accounts are filed up to ten months after year end.
The data is provided for the purposes of financial accountability, using formats based on company accounts. Although used for lots of different things, it’s not designed for those needs, and people working with it have to spend a huge amount of time and resources cleaning it and getting it into a useful state.
Secondly, it’s hard to connect different sources of data. The Office for National Statistics (ONS) can draw real-time data from sources such as PAYE, but it relies on company numbers to do it, and doesn’t draw information from the register of charities, so it can’t link up charity numbers with company numbers. As a result of this and other technical issues, as well as resource constraints, the ONS doesn’t provide data on the charity sector.
There’s also a problem with data collection within the sector itself. Everyone who collects data is asking different questions, segmenting charities and organisations in different ways, and storing data in different formats. This sounds extremely dull, but it’s important. If there were a consistent taxonomy of charity causes that everyone used, it would make comparison much easier.
Much of this is focused on charities, but when we begin to think about other parts of the sector such as social enterprises, co-operatives, or community businesses, it becomes even more confusing. Data is collected about all of these, within the sector and by government, however it is very rarely joined up or standardised for cross-sector use. Data on the charity sector excludes the rest of civil society, which is many times the size – perhaps as much as £200bn of activity, depending on how you count it.
What needs to be done about it?
There are innumerable potential solutions to this issue. There are many, many incremental improvements we could make to help us understand our sector better, and use that understanding to deliver more social good. Broadly, though, we think there are four really big interventions that need to be prioritised.
Strategy
Sitting in a room with a lot of people who think about data a lot, it becomes clear how many different questions there are, and how many different places there are to start. It seems obvious that we need some agreement and coordination. At present there are a lot of initiatives tackling parts of the problem, but they are not coordinated. They don’t all know about each other.
We need to speak to all the major partners, and get some agreement and buy-in for a coordinated strategy, so we all know where we’re going.
There are limits to this, obviously. The voluntary sector is pluralistic. We won’t get everyone lined up and marching in single file, and nor should we. If you want monoliths, look to the state.
But we do need to come together more than we have. We need to talk, reach compromises, and work together to understand where we are now, where we want to get to, and what will get us there.
Leadership
In order to deliver a strategy, we need bodies who can provide leadership. Doing good work with data involves following common practices and shared standards. It involves everyone knowing where data sets are. It involves coordinating so two different organisations don’t deliver the same work. And it involves making decisions about what improvements to prioritise first.
This leadership should be collaborative and networked. It should bring people and organisations together around a strategy, and work to the strengths of the many organisations already doing good work.
We’ve seen the impact of leadership with 360Giving. This charity, with a relatively small budget, has made huge improvements in the quality and availability of data on charity funding. Now, for the first time, it’s getting easier to understand who gives what money to which causes, and where.
But that’s just one dataset. There are many, many others that need the same treatment, and several come with problems that make them thornier than grant funding – which was thorny enough.
We’re starting to see emergent leadership, not least from the Data Collective itself, and we’ve seen good work from NCVO. But there is much more that can be done.
Engagement
Some of the things that can support better data about the sector can be done within the sector itself. However, we also need improved data collection from government institutions, particularly the Office for National Statistics, Companies House, and the Charity Commission. In the end, charities don’t have the power to mandate what other charities do, and we don’t have the clout of the ONS. So to get better data, intervention from these bodies is absolutely crucial.
The ONS is aware that better data on civil society is an important priority, but it has other important priorities as well. Improvement is needed in measuring household activity, natural and social capital, and the value of the state itself. Civil society is just one of many things on the list, and unless we engage and ask for help, we may find ourselves low down.
The Charity Commission is working on new data classification methods, including new taxonomies around charity income and activity, but if the sector does not engage with this process, we will not get the results we want.
A twin approach is vital and we must engage across civil society and government with a clear strategy for change.
Funding
Finally, this process will need money. At present, various funders are making available small pots of money to improve data on the charity sector, but more is needed. If we are to gather decent data on the voluntary sector, the work must be funded.
It’s easy to see this as a lower priority when there are so many causes that need urgent frontline support, but it is part of a wider problem in the sector: lack of investment in resources. Better data will, in the long run, enable much more effective and targeted spending on the sector, as well as helping lobby for an enabling environment from government. If relatively small sums are not spent now, we will not be able to make those improvements.
So what next?
Right now good work is being done in a large number of places, but we need some collective action and collaborative leadership to move us forward, together. As a next step, we’re establishing a steering group, via the Data Collective, of people working on initiatives that are creating data about the sector. We want those people to come together to:
- learn about what others are doing
- discuss challenges
- align work
- build agreement on a vision of what is needed
- agree practical next steps we can collectively take forward immediately
If you would like to hear more about this work or be involved please get in touch with Roz Sutton.

Data Visualisation at Citizens Advice
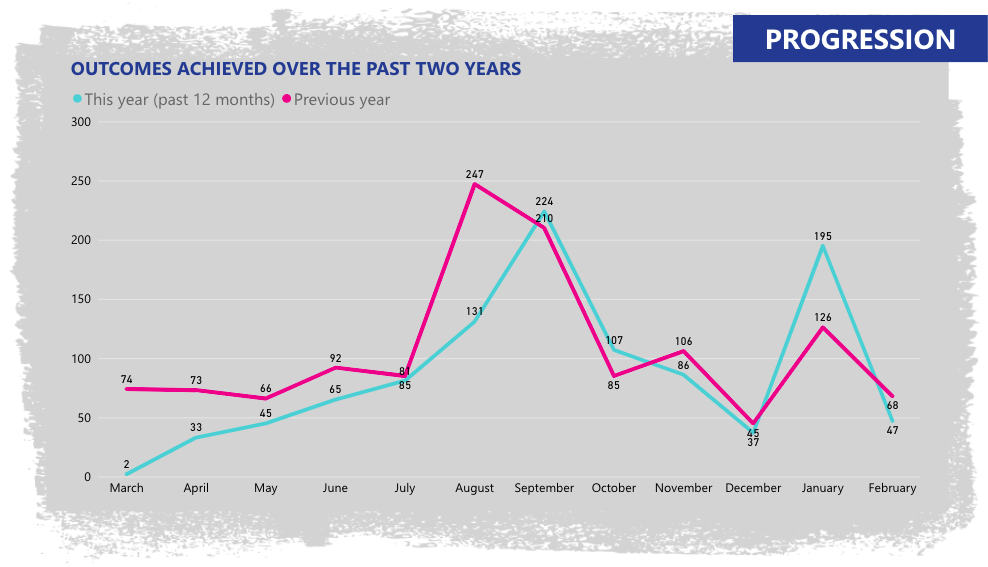
Citizens Advice has a dedicated data team to make sense of the 25 million visits they get to their website each year. They publish this data publicly for researchers, funders and other external stakeholders, as well as for the convenience of staff and their network of local Citizens Advice organisations.

In 2008 they started using Tableau and Google Data Studio instead of just providing flat Excel files and Word documents, so people could easily filter and interact with the data. You can see their data visualisations for yourself, find out more in their blog We Are Citizens Advice, or contact them directly with questions at datateam@citizensadvice.org.uk.